
Intro
Home Assistant is a great Home Automation Software. It provides features and benefits that surpasses the software provided by the Hardware Manufacturers by far. One such example are my TP-Link HS110 Smart WiFi Plugs with Energy Monitoring. The provided App by TP-Link (Kasa) is limited:
- only one Smartphone or Tablet can manage the plugs (I do not want to use their cloud solution)
- it does not provide any history graph, only displays average values
This is where Home Assistant kicks in. Not only I can control my devices with any Browser enabled device, I can also keep track of my power consumption.
Understanding Attributes
In Home Assistant, each device is an object. An Object can have attributes. The TP-Link Switch Component in Home Assistant provides following attributes:
- Total Consumption
- Current
- Current Consumption
- Voltage
- Daily Consumption
A typical setup of a Device would look like this:
# Example configuration.yaml entry of a TP-Link Switch
switch:
  - platform: tplink
    name: Bureau
    host: IP_ADDRESS
In the Example above, we name our Switch “Bureau“, the object’s name in Home Assistant will become “switch.bureau”
Once setup, it will show up in Home Assistant, with it’s current state (on or off), and it’s attibutes :
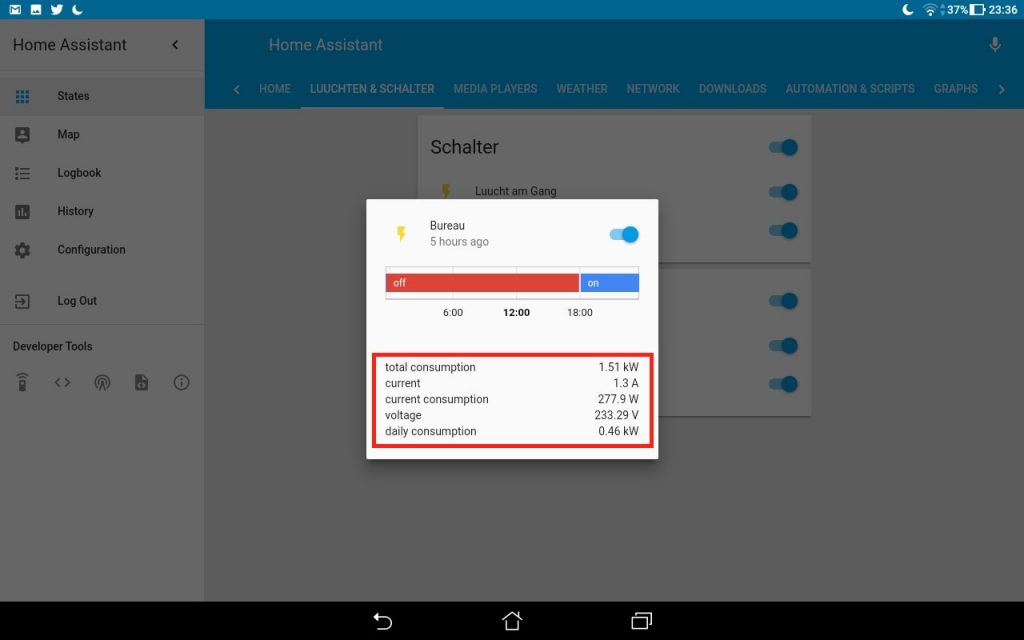
Pop up Window in Home Assistant with the state and attributes
For a better understanding, I recommend checking the proper attribute name used by Home Assistant by going into the “states” section of the “Developer Tools”
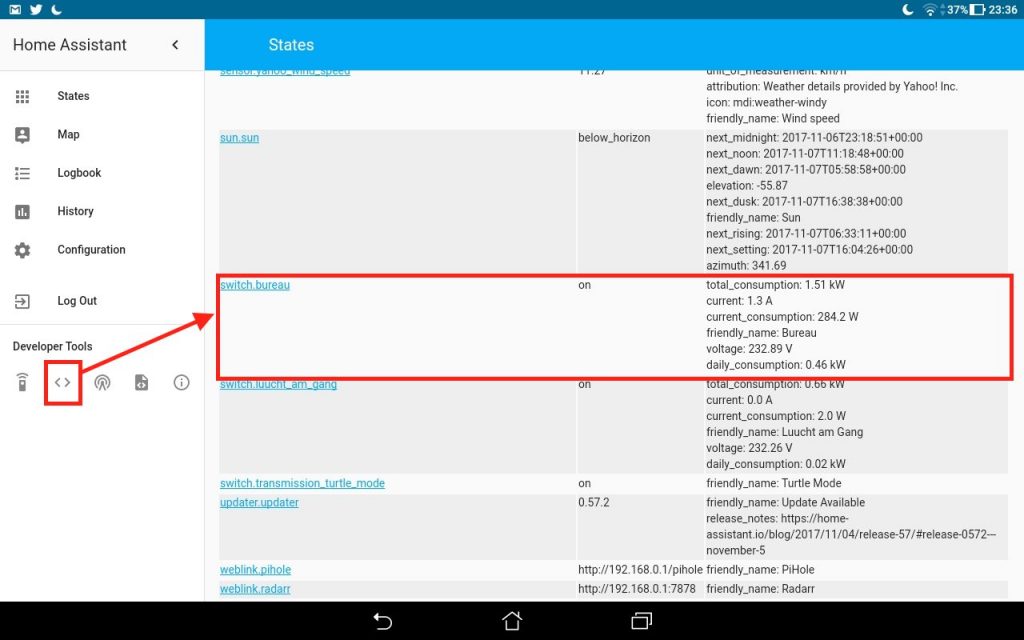
Developer View of Object’s Attributes
In this example, I want to plot a graph from attribute “current_consumption” from object “switch.bureau”
Grab the attributes we want to plot
Ok, so now that we know the name of the attribute, we need to tell Home Assistant how to get it. For this, we are going to use the “Template Sensor” Component. It’s important to use the sensor variant, although our object is a “switch” component.
# Example configuration.yaml entry
sensor:
  - platform: template
    sensors:
      bureau_power_sensor:
        value_template: {{states.switch.bureau.attributes.current_consumption}}
        unit_of_measurement:  W
In the Example above, we define the sensor’s name (bureau_power_sensor) and which attribute (current_consumption) to read from a specific object (switch.bureau)
Now that we have the attribute defined as a Data Source it’s time to..
Plot the graph
Introduced in version 0.55, the History Graph Component does exactly what we want.
# Example configuration.yaml entry
history_graph:
  power:
    name: Power Graph
    entities:
      - sensor.bureau_power_sensor
The Graph is placed into the group “power” (handy if you have multiple plugs) and it’s name is “Power Graph” (which will become the entity / object history_graph.power_graph in Home Assistant)
If you have grouped your view, an example groups.yaml would look like this:
# Example groups.yaml entry
graphs:
  name: Graphs
  view: yes
  entities:
    - history_graph.power_graph
Here’s the Result:
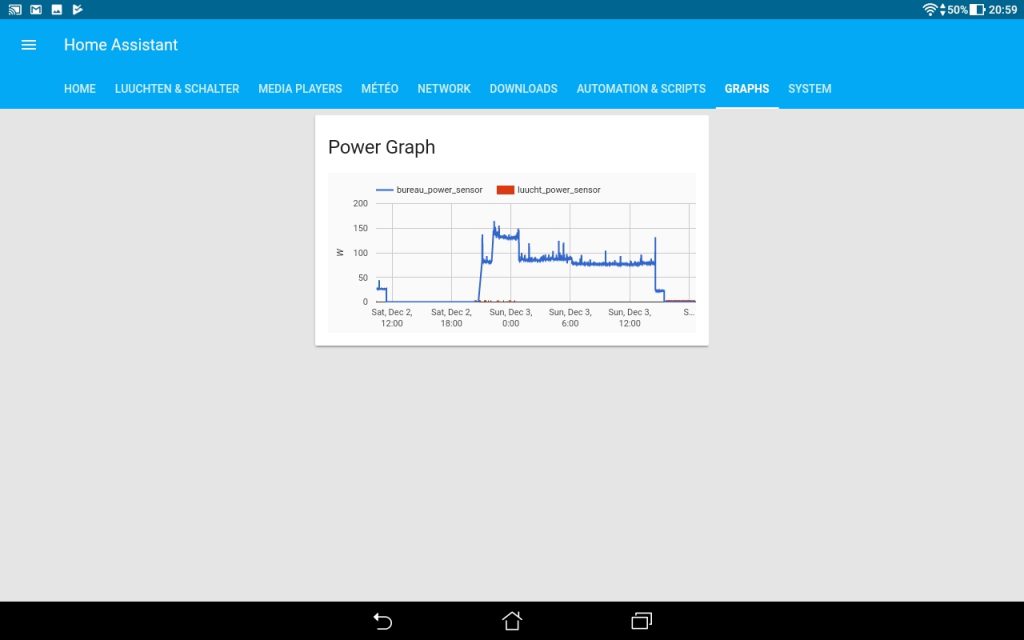
History Graph of a TP-Link HS100 Smart Wifi Plug


Rezent Kommentare